I have reason to believe, although I cannot say with scientific certainty, that the percent change in the top marginal tax rate has historically been a three-year leading indicator of the percent change in the real gross domestic product. The reason we can’t know for sure is that there is not enough data (the rate is rarely changed in recent times).
This conclusion fits with the findings of the Research Department of the International Monetary Fund, and the publication “Redistribution, Inequality, and Growth” by Jonathan D. Ostry, Andrew Berg, and Charalambos G. Tsangarides. They studied the issue across many countries, whereas this chapter is focused on the history of GDP in the United States. They found that, “redistribution appears generally benign in terms of its impact on growth.” In other words, taxing the rich doesn’t slow the economy.
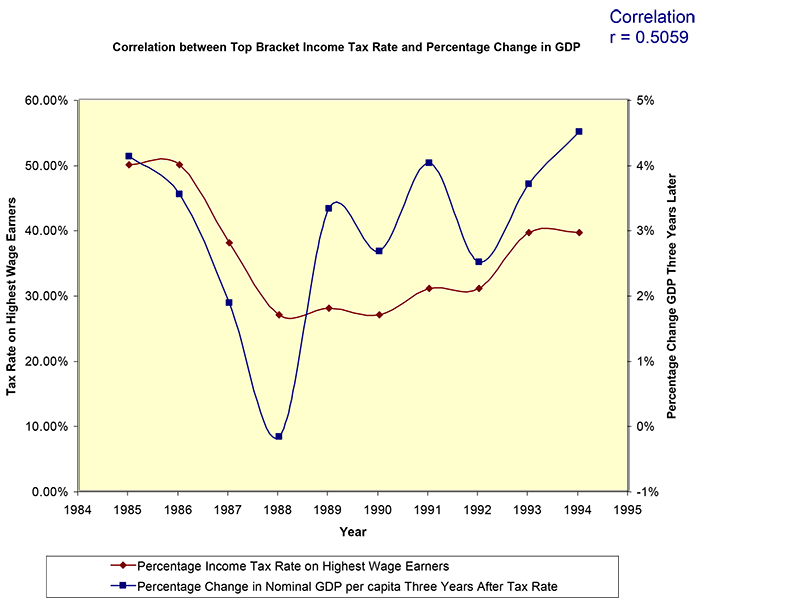
The top tax rate for the years 1985-1994, a period during which the top rate was modified frequently was graphed along with GDP for the years 1988-1997 (for almost two decades before 1985, the top tax rate was steady at 50% so it doesn’t provide enough information, and from 1994 to 2000, it was steady at 39.6%, also not so interesting).
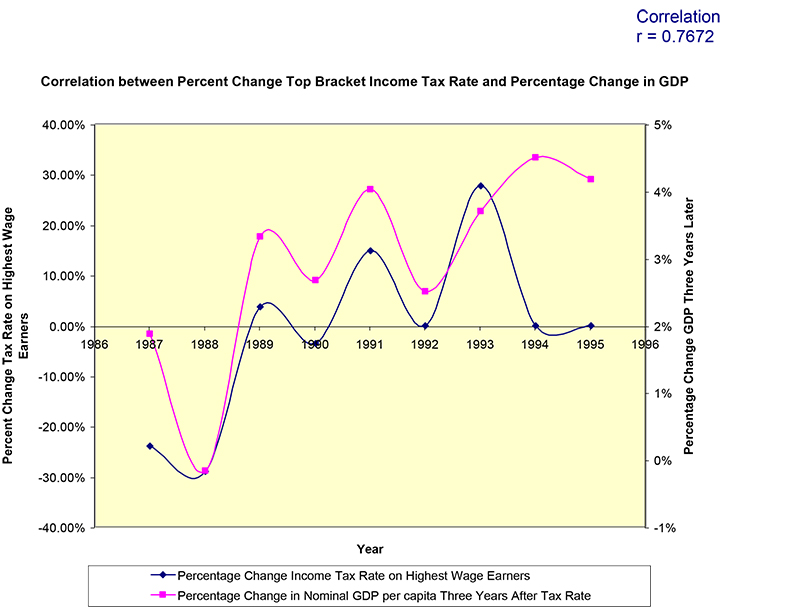
Both variables were graphed (as percentages) against time, and overlaid (the first graph being the % change in tax rate from the previous year and the second graph being the % change in GPD from the previous year). They seemed to run in a similar curve, so when the GDP graph was shifted three years back in time (the reason for the two time periods), it made evident the significant result. What this shows is that the effect on GDP is realized three years after the policy shift regarding the top marginal tax rate.
As the rate of tax paid by the very rich is increased, the GDP rises three years later and conversely, as the tax rate is decreased, GDP falls. Therefore, the top tax rate seems to be a three-year leading indicator of the productivity of the economy, with a correlation of r = +0.77 during the study period. At r=+1.0, it would be a perfect predictor – a 100% guarantee. R squared is the predictability, so that 59% (0.77×0.77) of the time, you can say that there is a direct relationship between the two measures. As tax rate goes up, GDP goes up three years later 59% of the time. If trickle down economics were a valid theory, the empirical data would more likely show a negative correlation (tax goes down, GDP goes up), but this is not at all the case.
What I think this shows is that the redistributive wealth effects of a higher top marginal tax rate are more beneficial to the health of the economy than the benefits that comes from giving tax cuts to the wealthy, which may prime Wall Street in the very short term, but leave the overall system weak and susceptible to shocks, thus placing downward pressure on GDP growth over the longer term.
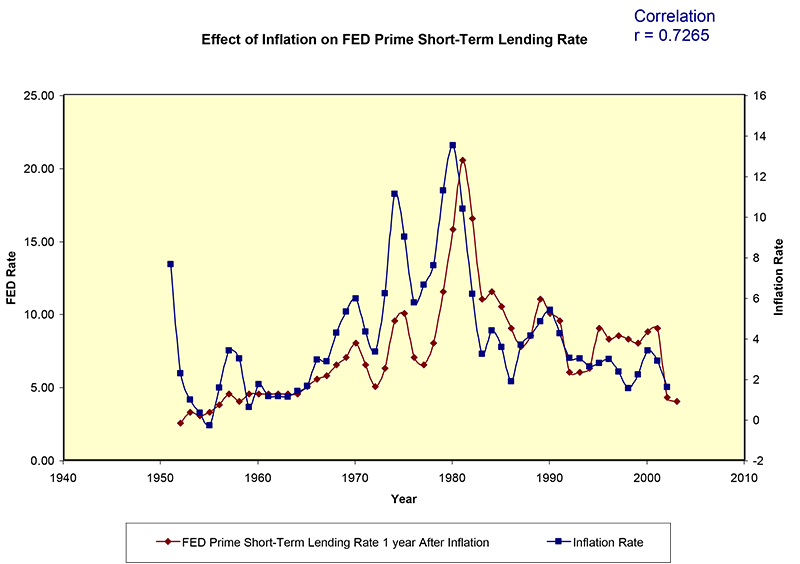
Above is a similar type graph of variables that it is universally agreed are correlated with the one acting as a leading indicator of the other: the inflation rate and the fed short term lending rate. They are shifted by one year to reveal the greatest correlation (r=+0.73 from 1950 to 2000).
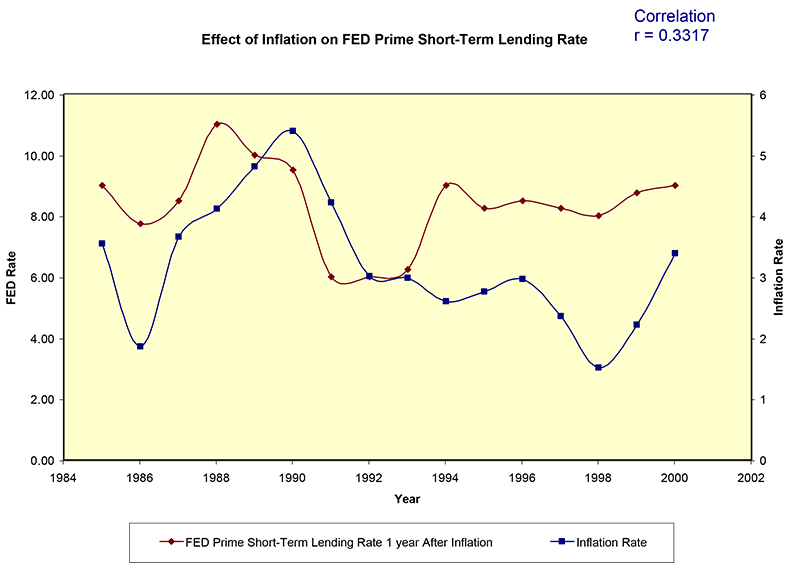
During the main focus period for this study (1985-1994), they are correlated at r=+0.33 pg2. It should be noted that there are many other factors involved in the decision to raise short term rates, just as there are many factors involved in the productivity of the economy as a whole.
However, as the graphs below show, where trickle down theory claims that the single factor of tax rate cuts on the wealthy actually can stimulate growth, it is quite apparent that the opposite is indeed the case. If the argument is made that decreasing taxes on the very wealthy can have a corollary to the economy doing well, and it is instead shown that the correlation is indeed the opposite of that, one can not then argue that the effect of taxes on economic growth is obscured by other variables to cause a false result. Consistency of argument is required here.
There are two main explanations for this result. The first is that as the tax rate is raised on the investor class, it often brings about the utilization of loopholes that allow for tax breaks on invested assets (as was the case in the 1950s). So the rich are obligated to put more money into long term capital investments and this stimulates growth. Otherwise they would have to write a check for the full amount, which has historically ranged as high as 91%-94% from the end of WWII up till 1959. The second reason is that no matter how many loopholes there are in a rate that is 50%-90%, the government is going to take in more revenue than it will when it is at 35% (where it sits today – 2006). The safety net that this increase in public assets is able to provide through governmental largess (for people that find themselves out of work or those able to get a subsidized-interest loan or tax breaks for their small business) has a positive influence on the growth of the economy as a whole.
The sources for the numbers are as follows:
http://www.cbo.gov/showdoc.cfm?index=5324&sequence=0#table1A
http://eh.net/hmit/
http://www.ctj.org/pdf/regcg.pdf
http://research.stlouisfed.org/fred2/series/PRIME/downloaddata/PRIME.xls